
Chartio Review
Our score 9
What is Chartio?
This software exceeded my expectations!
After using this software for some time, I can confidently say that it has completely revolutionized the way I analyze data. With its intuitive interface and powerful features, I was able to generate insightful reports and visualizations in a matter of minutes. The ability to seamlessly connect to various data sources made the process so much more efficient.
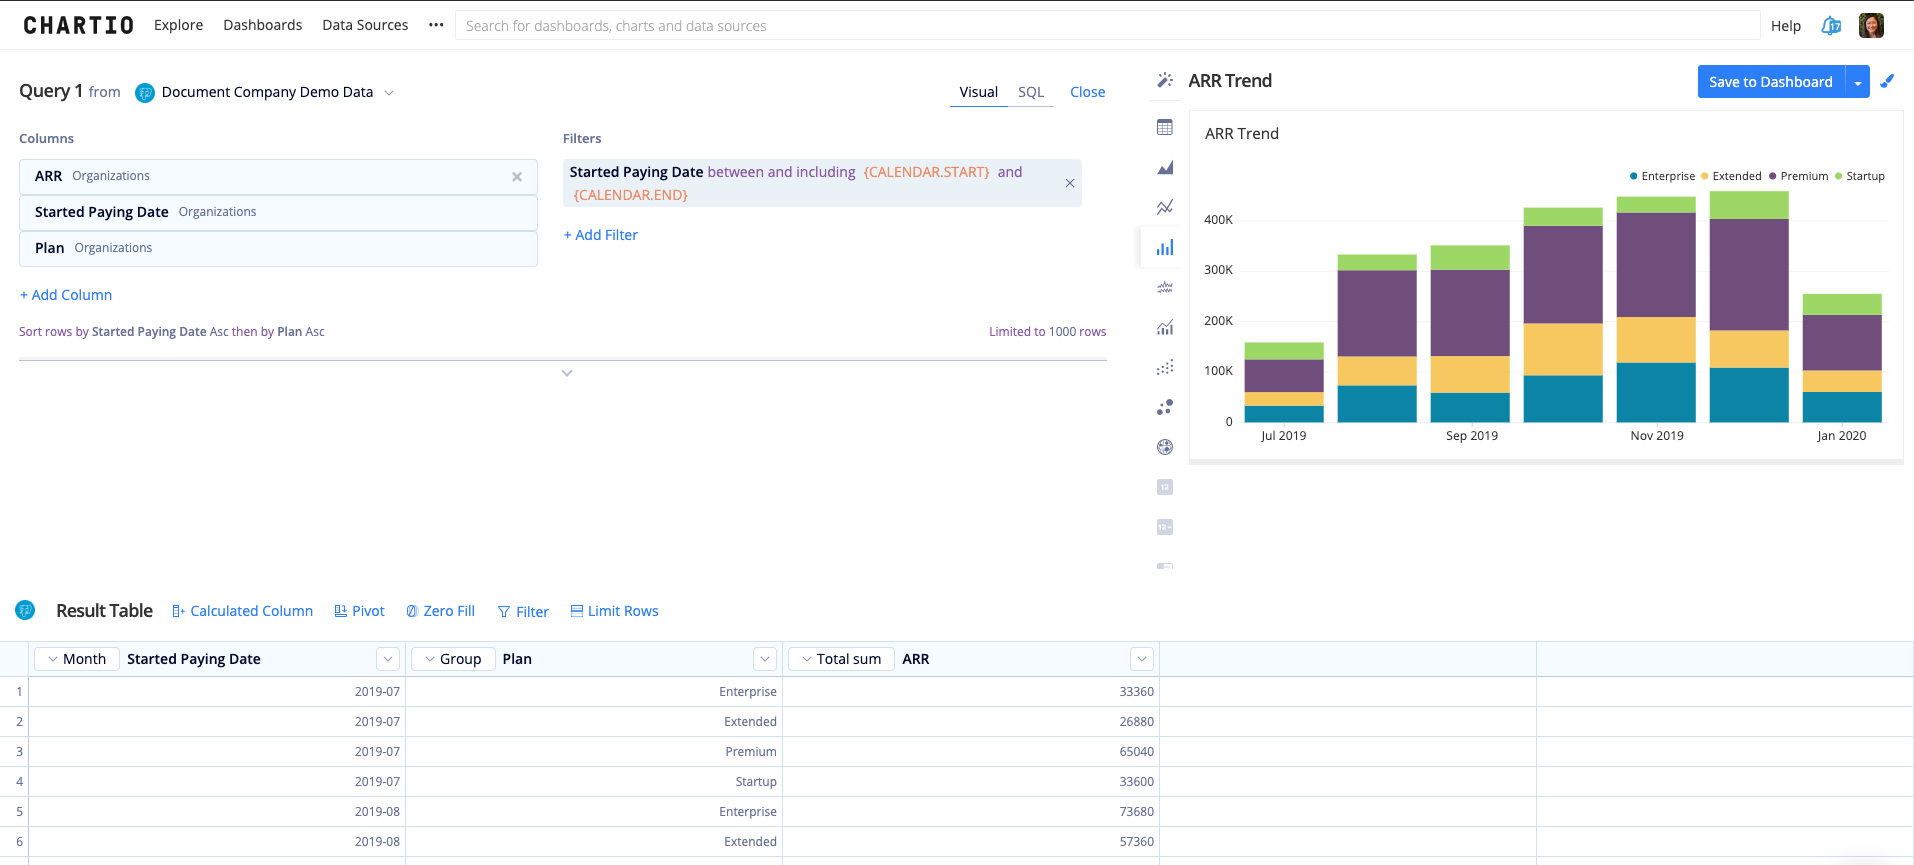
- The drag-and-drop interface made building charts and dashboards a breeze.
- I was able to easily share my visualizations with my team using the collaborative features.
- The extensive library of chart types allowed me to choose the best visualization for my data.
- The customer support team was responsive and helpful whenever I had questions or needed assistance.
This software has truly transformed the way we analyze data. I highly recommend it to anyone looking to gain valuable insights from their data.
Key Features:
- Drag-and-drop interface
- Collaborative features
- Extensive library of chart types
- Responsive customer support
FAQ:
Q: Can I connect this software to multiple data sources?
A: Yes, this software allows you to connect to various data sources to consolidate your data for analysis.
Q: Is there a limit to the number of visualizations I can create?
A: No, you can create as many visualizations as you need to effectively analyze your data.
Overview of Chartio
Overview of Chartio Features
- Dedicated Support
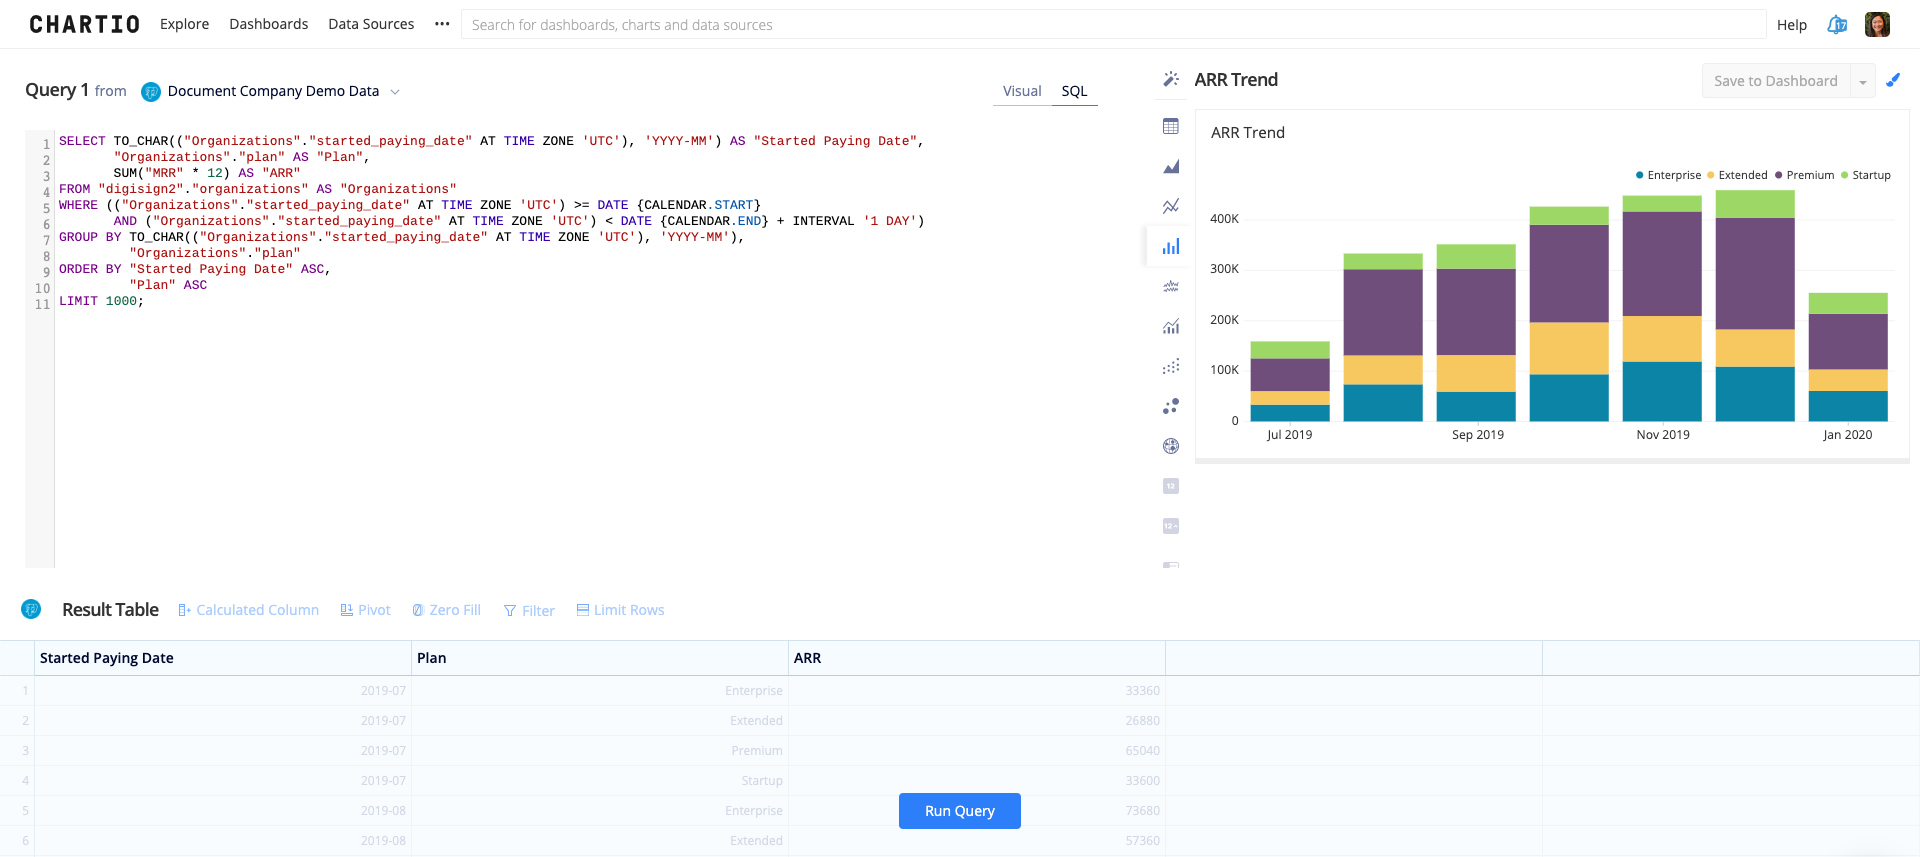
- Edit Generated Queries
- The Strongest Connections
- Scheduled Email Reports
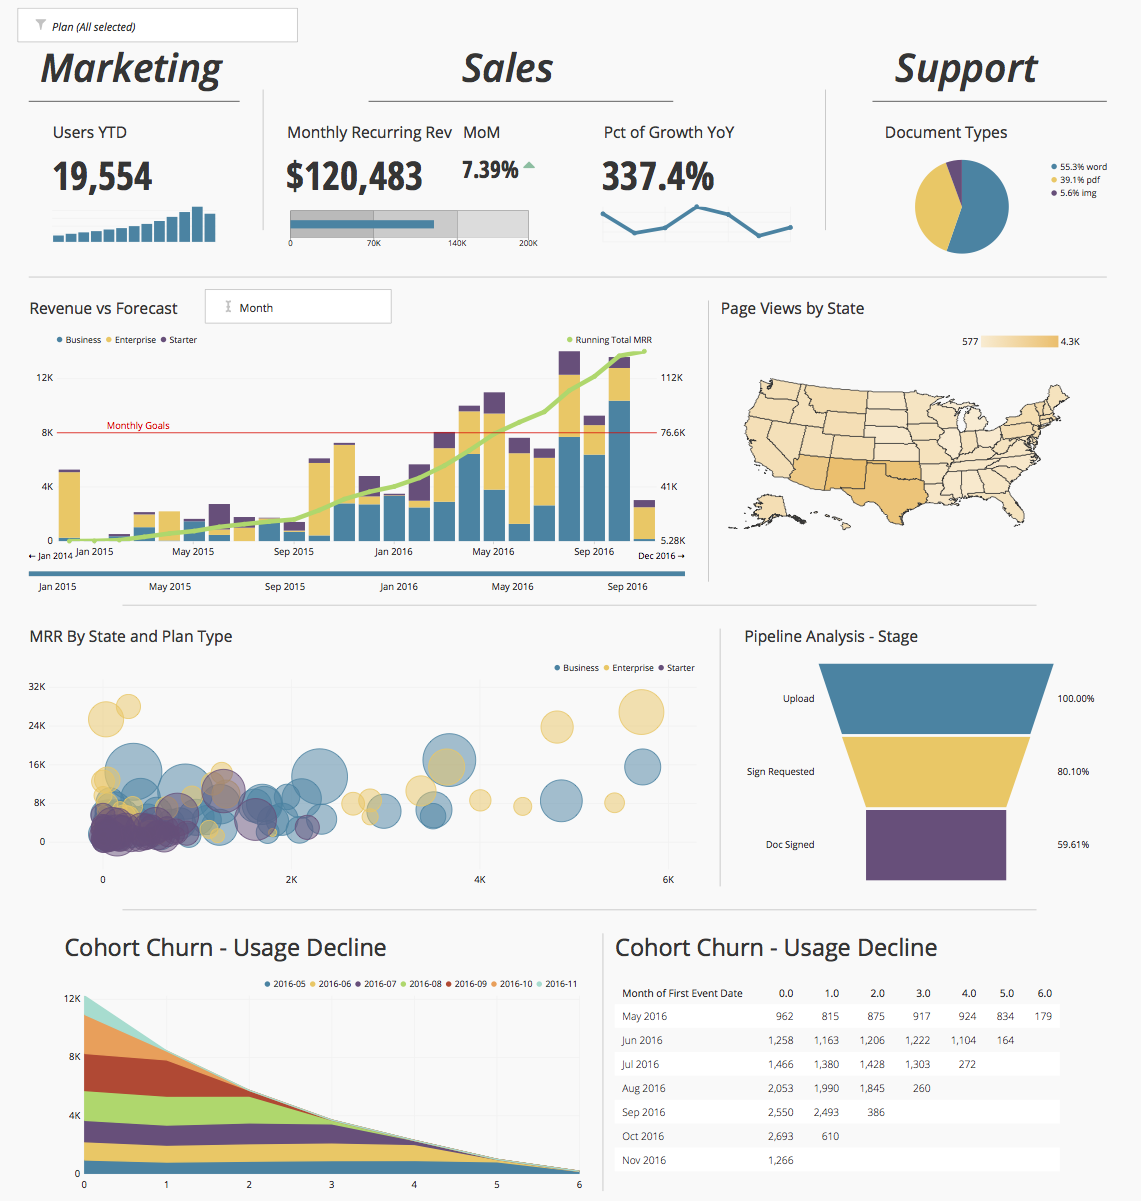
- Visualize Funnels
- Add Custom Columns
- Richly Collaborative
- Query mode
- Powerful Query Mode
- Download and Share Anything
- One Interface for Every Data Source
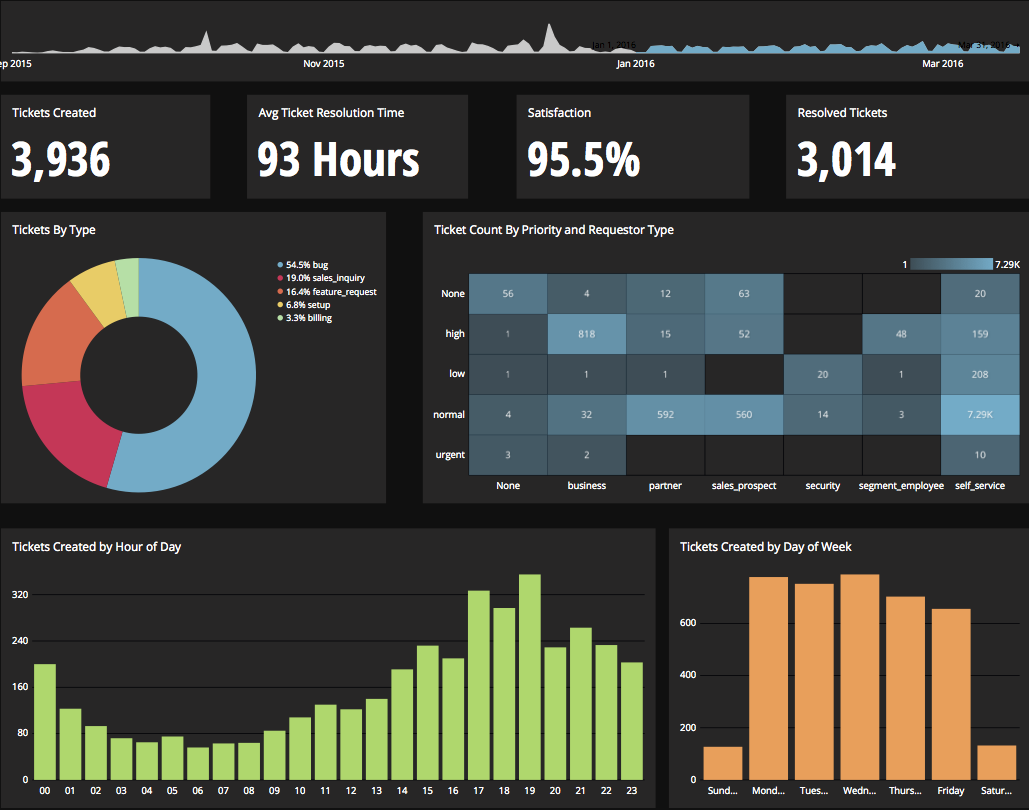
- Real time chart
- Drag and Drop UI
- Controlled Access
- Easily Try any Visualization
- Download Any Visualization
- Quickly See Any Visualization
- Real-time Results
- No-Limits Interface
- Join Data Sources in a Single Click
- Drag and Drop Chart Creation
- Works on Any Device
- Company Revenue Dashboard
- Blend Disparate Data
- Create Charts on Tablets & Phones
- Scheduled Reporting
- Powerful Filters
- Easily Perform Complex Calculations
- Drill Down & Pivot
- Share Dashboards with a URL
- Collaborative
- The Fastest Connections
Gallery
Videos
Downloads
Pricing Plans
$40
Per user/month
$60
Per user/month
Add New Comment