
SharePoint Gantt Chart Web Part Review
What is SharePoint Gantt Chart Web Part?
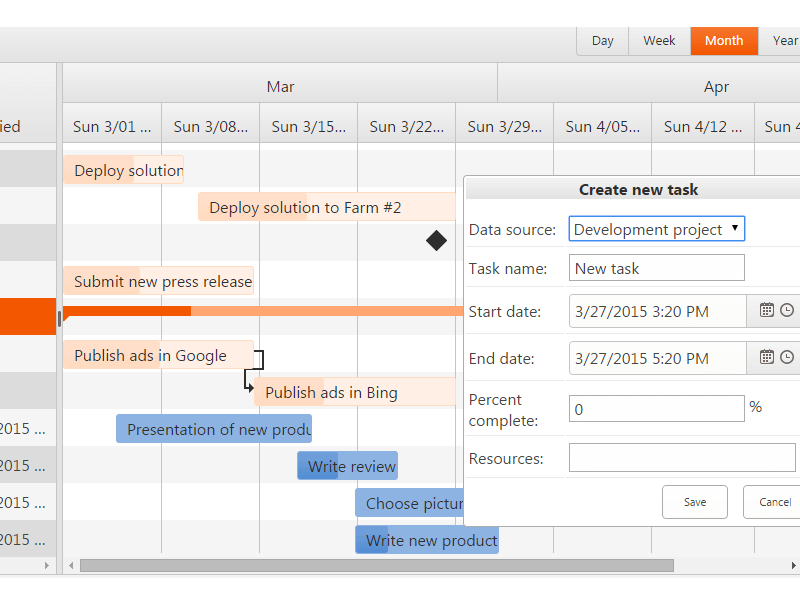
SharePoint Gantt Chart Web Part is an easy-to-use SharePoint and Office 365 project management tool for viewing SharePoint 2019, 2016, 2013 and 2010 tasks as a Gantt Chart. With this solution, a SharePoint user can have all his tasks and subtasks in a single Gantt view, easily create and complete tasks, assign resources, edit timeframes and percentage of completion with a few clicks. Key features of Virto SharePoint Gantt Chart Web Part and App: 1. Displays tasks into two views — table view and Gantt chart view. One of the most future-rich solutions for SharePoint and Office 365 task management is Virto Gantt Chart. You can display SharePoint task lists using the Gantt Chart and have the whole structure of your project with tasks planned within your SharePoint site in one view. You can change a task order and status with drag & drop feature, define parent-child relations, and use many other abilities of this effective SharePoint project management tool. 2. Real time synchronization. Any changes you make to the tasks in the SharePoint Gantt Chart are displayed instantly. No reason to run a special synchronization process to apply changes to the Gantt view and to the data source. 3. Supported timescales (hour, quarter days, days, weeks, month, quarters, half years). Depending on the quantity of your SharePoint tasks or the details you would like to analyze, the SharePoint Gantt Chart allows you to choose the most appropriate timescale. 4. Allows creating new task, deleting and editing current task. SharePoint Gantt View web part takes tasks from SharePoint lists you define on start. Nevertheless, you need not navigate to the source list in order to create, delete or edit tasks. Do it in real time right in the SharePoint Gantt chart. 5. Display tasks from several SharePoint lists. Use multiple SharePoint lists to display tasks in a single SharePoint Gantt Chart. When required, you can easily use more than one data source and adjust tasks to be displayed. It’s also possible to color-code summary tasks and highlight them with choosing colors of background row and foreground row.


Add New Comment