
Logi Analytics Review
Our score 8.1
What is Logi Analytics?
Logi Analytics Review
As a tester and user of Logi Analytics, I was thoroughly impressed with the features and functionality that this software provides. It falls under the categories of Business Intelligence Software and Embedded Business Intelligence Software, making it a versatile tool for businesses of all sizes. Here is my comprehensive review:
Easy Integration and Customization
One of the standout features of Logi Analytics is its ease of integration with existing systems. Whether you are using CRM software, data warehouses, or other business intelligence tools, Logi Analytics seamlessly integrates with them, allowing for a smooth transition and consolidation of data. Additionally, the software offers a highly customizable interface, making it simple to tailor the user interface to match your brand and specific business needs.
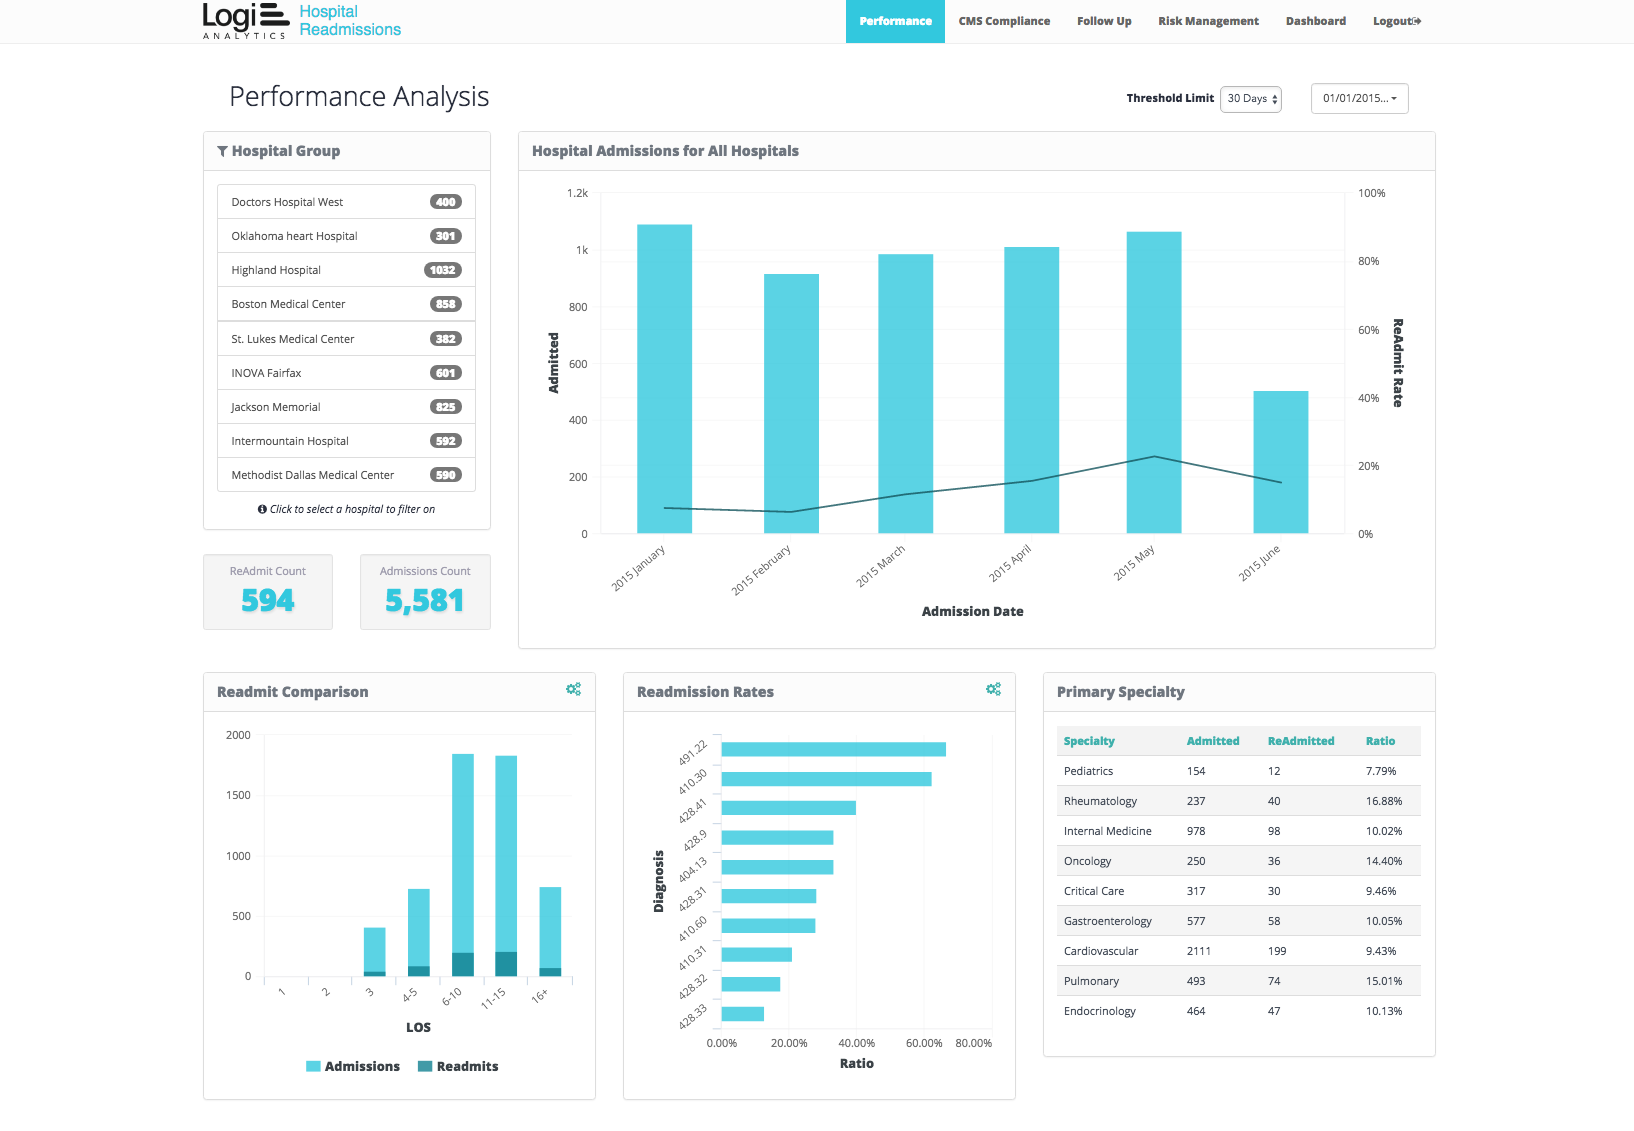
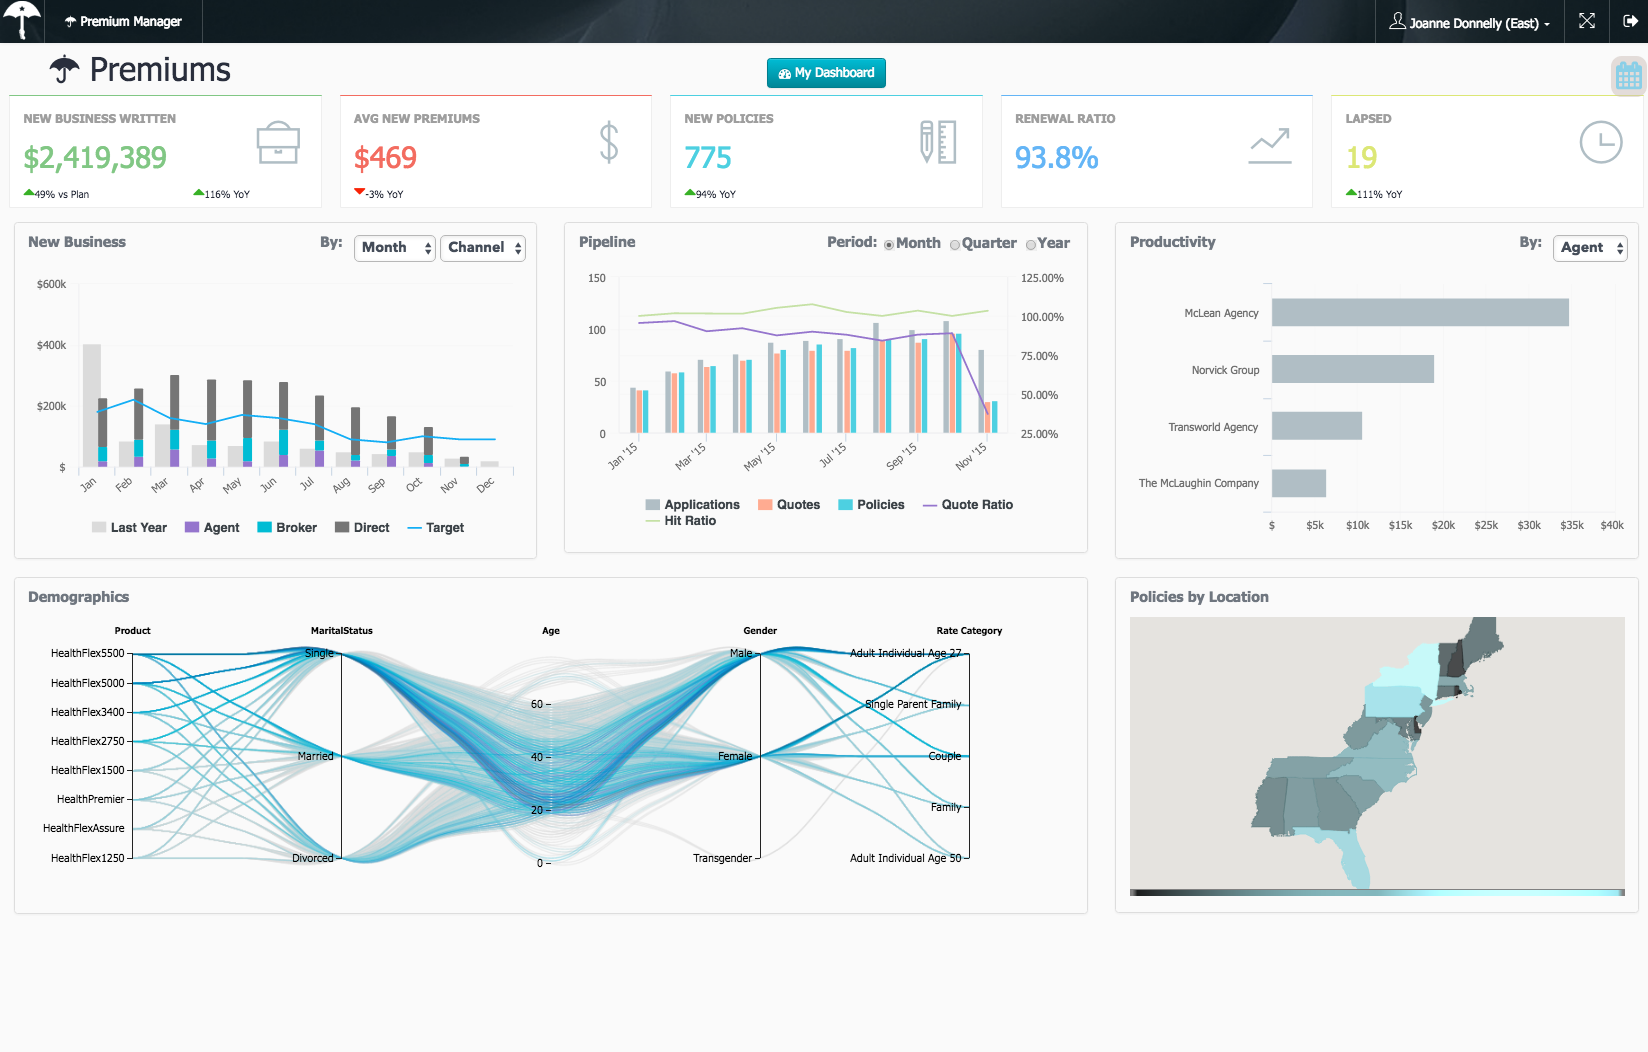
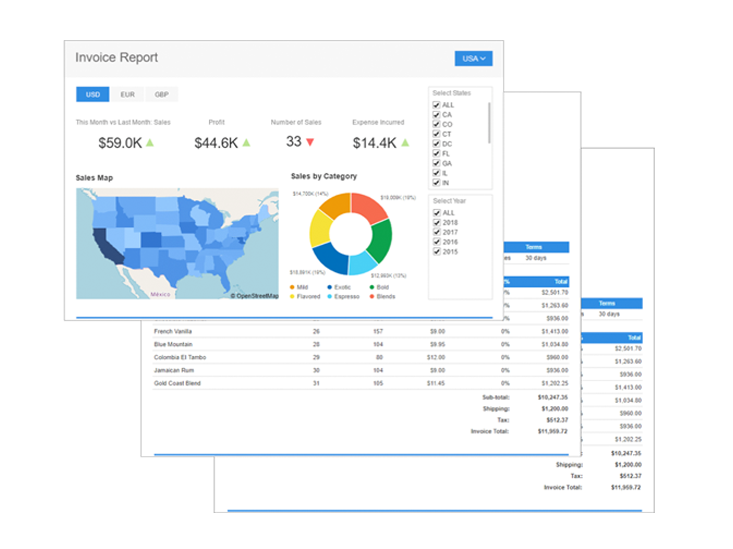
Powerful Data Visualization
Logi Analytics excels in its data visualization capabilities. The software offers an extensive range of charts, graphs, and dashboards, enabling users to present complex data in a visually appealing manner. The interactive features allow for easy data exploration, allowing users to drill down into specific data points for deeper analysis. The ability to create dynamic reports and dashboards makes Logi Analytics a valuable tool for presenting business insights to stakeholders and decision makers.
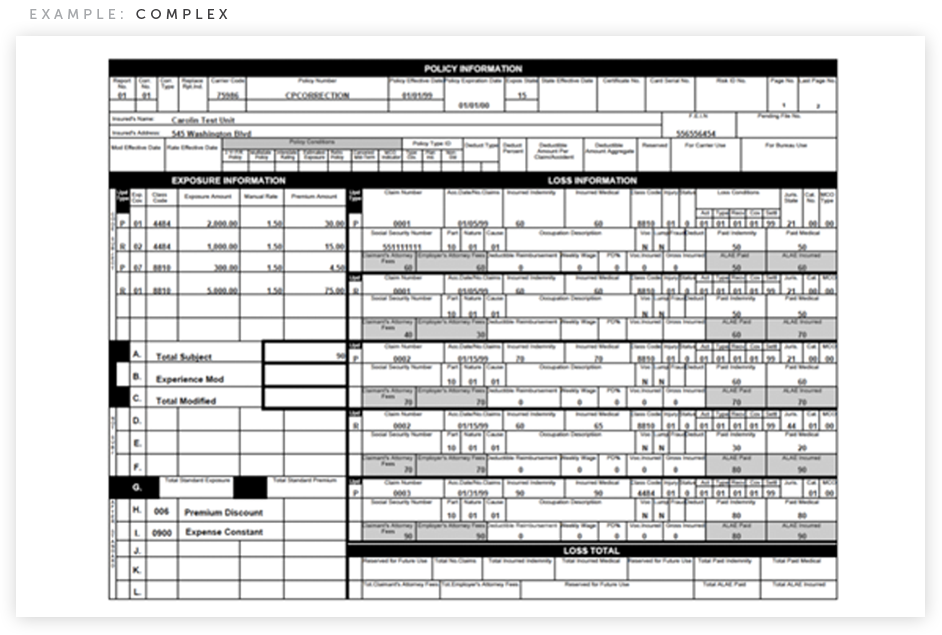
Advanced Reporting and Analytics
With Logi Analytics, users can easily create and customize reports to suit their specific needs. The software offers a variety of formatting options, including charts, tables, and cross-tab reports, ensuring that data is presented in a clear and concise manner. The advanced analytics features go beyond basic reporting, allowing users to perform complex data calculations, predictive analysis, and statistical modeling. These capabilities enable businesses to gain valuable insights and make data-driven decisions.
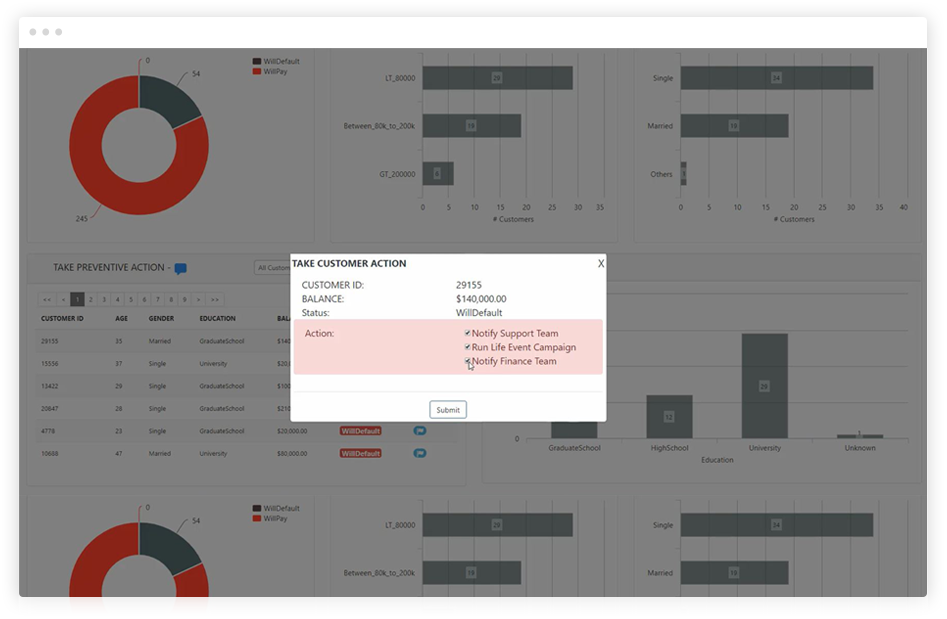
Collaboration and Sharing
Logi Analytics facilitates collaboration among team members by allowing users to share reports, dashboards, and visualizations. Users can also set up automated report delivery, ensuring that stakeholders receive the latest information on a regular basis. The ability to embed reports and dashboards into other applications or websites is another notable feature, making it easy to share information with clients or customers.
Customer Feedback
Here are some quotes from other users of Logi Analytics:
- "Logi Analytics has transformed the way we analyze and present data. The software is intuitive and highly customizable, making it a valuable tool for our business intelligence needs." - John D., CEO
- "The data visualization capabilities of Logi Analytics are unmatched. The ability to create visually stunning dashboards has greatly improved our ability to communicate complex data to stakeholders." - Emily S., Marketing Manager
- "Logi Analytics has simplified our reporting processes and saved us valuable time. The advanced analytics features have allowed us to uncover valuable insights and make data-driven decisions." - David R., Financial Analyst
Key Features of Logi Analytics:
- Easy integration with existing systems
- Highly customizable interface
- Extensive range of charts, graphs, and dashboards
- Interactive data exploration
- Advanced reporting and analytics capabilities
- Collaboration and sharing features
- Embedding reports and dashboards
Frequently Asked Questions (FAQ)
- Can Logi Analytics be integrated with other business intelligence tools?
- Yes, Logi Analytics has the ability to seamlessly integrate with other business intelligence tools, allowing for the consolidation of data and a unified analytics solution.
- Can Logi Analytics be customized to match our brand?
- Absolutely! Logi Analytics offers a highly customizable interface, allowing you to match the software's look and feel to your brand.
- What types of data visualizations can be created with Logi Analytics?
- Logi Analytics provides a wide range of charts, graphs, and dashboards to visualize your data. These include bar charts, line graphs, pie charts, heatmaps, and more.
- Can Logi Analytics perform advanced calculations and statistical modeling?
- Yes, Logi Analytics offers advanced analytics capabilities, allowing users to perform complex calculations, predictive analysis, and statistical modeling.
In conclusion, Logi Analytics is a powerful and versatile business intelligence software that offers seamless integration, customizable interface, advanced reporting and analytics capabilities, and collaboration features. Its data visualization capabilities are exceptional, and the software has received positive feedback from users. Whether you are a CEO, marketer, or financial analyst, Logi Analytics has the tools to help you make data-driven decisions and present business insights effectively.
Overview of Logi Analytics
Overview of Logi Analytics Features
- Custom Styling & Branding
- SVG Charts
- Open Web Architecture
- Client-Side Interactive Visualizations
- Reports
- Single Sign-On Support
- Low-Code Development
- Security Options
- Data Blending & Co-Presenting
- Self-Service Analysis
- Themes Library
- Exporting Capabilities
- Custom Plug-Ins
- Interactive Dashboards
- Theme Editor
- JavaScript Embedding API
- Workflow Management
Gallery

Popular Logi Analytics Alternatives

Report a problem Claim this Profile
Add New Comment